How to Make a Timeline on Google Sheets: Project Timeline Template

A timeline answers the question everyone actually cares about: what happens, and when. And you don’t need special software to draw one. Google Sheets can do it two ways, one built in and effortless, one fully custom.
If you just want to see your milestones laid out over time, the built-in Timeline view takes about a minute. If you want more control over the look, a stacked bar chart gives it to you.
This guide covers both ways to build a timeline on Google Sheets, then shows you how to keep the files behind each milestone attached where they belong.
Key Highlights
- Google Sheets has a built-in Timeline view (Insert → Timeline) that turns a table with dates into an interactive timeline, no chart-building needed.
- For full visual control, a stacked bar chart builds a custom timeline (the same technique used for Gantt charts).
- The built-in view lets you color and group cards by category or owner in a couple of clicks.
- Timeline view is fastest for lightweight planning; the chart method is better for polished presentations.
- A timeline shows when each milestone lands, but not the files behind it. UpSheet is a Google Sheets extension by The Conductor that lets you attach the deliverable or asset to each milestone’s row, so the plan and the work stay linked.
What data does a timeline on Google Sheets need?
Both methods start from the same clean table. Open a new Google Sheet and create:
- Task or milestone (A)
- Start date (B)
- End date (C)
- Owner or category (D), optional but useful for grouping
Format the date columns as dates (Format → Number → Date). That’s your foundation.
How do you use the built-in Timeline view?
This is the fast path, and it’s genuinely good.
- Select your data range, including the headers.
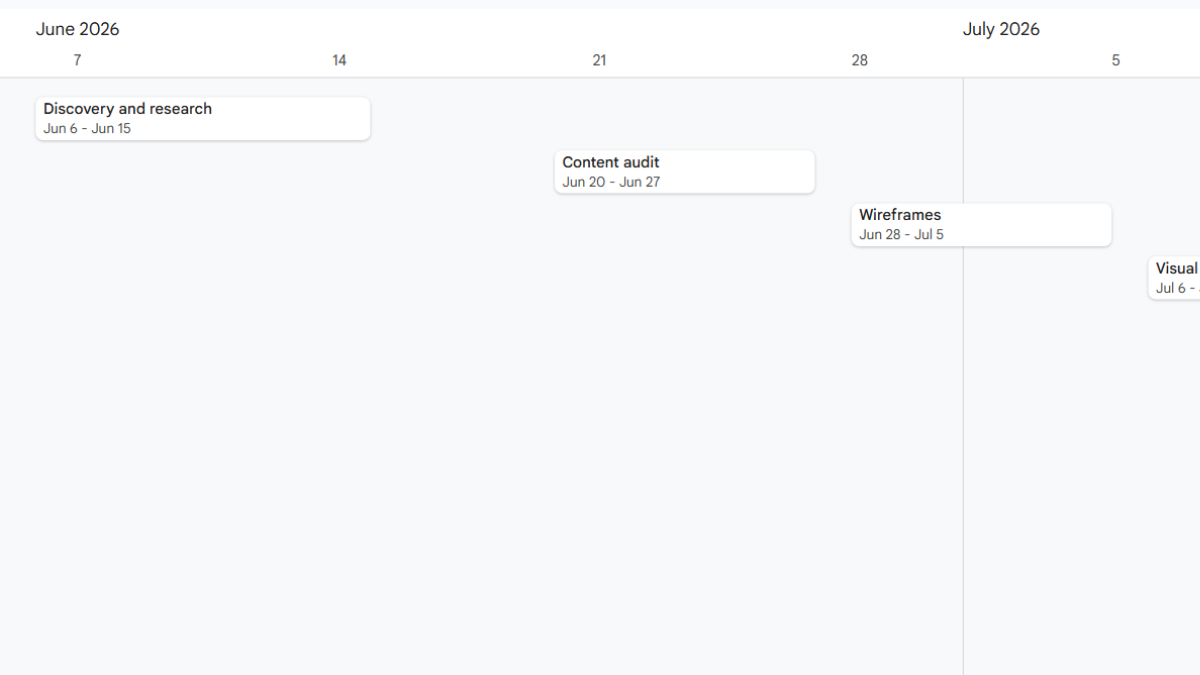
- Go to Insert → Timeline.
- In the dialog, confirm the range and click Create.
- In the timeline settings, set the Card start date and Card end date to your date columns, and pick a Card title.
Google Sheets draws an interactive timeline you can zoom by day, week, month, quarter, or year.
To make it more useful, open the timeline’s settings panel and set Card color or Group by to your Owner or Category column. Now milestones are color-coded and grouped without any formulas.
How do you build a custom timeline with a chart?
If you want a timeline you can style and drop into a slide, use a stacked bar chart. In short:
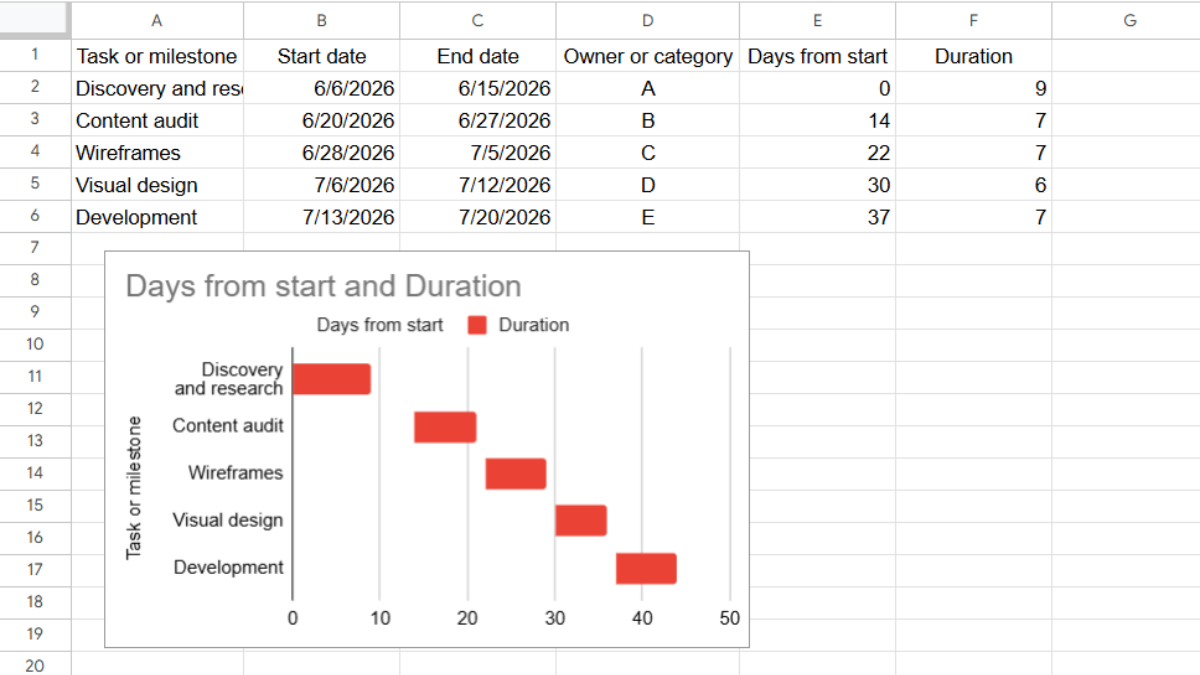
- Add two helper columns: Days from start (=B2-MIN($B$2:$B$9)) and Duration (=C2-B2), formatted as numbers.
- Select the milestone, days-from-start, and duration columns.
- Go to Insert → Chart and choose Stacked bar chart.
- In Customize → Series, set the Days from start series to 0% fill opacity so only the duration bars show.
- In Customize → Vertical axis, check Reverse axis order.
This is the same method used to build a Gantt chart, so if you need dependencies and detailed scheduling, that fuller guide is the next step.
Where do the milestone files live?
Here’s the limitation both methods share. A timeline shows when a milestone happens, but the milestone is really about a deliverable, a launch asset, a signed-off design, a final report. And that file isn’t in the timeline.
So the schedule sits in Sheets while the deliverables scatter across Drive and email. When a milestone arrives and someone asks “where’s the final version?”, the timeline can’t answer.
This is where UpSheet fits in. UpSheet is a Google Sheets extension, built by The Conductor, that lets you drag and drop files straight onto a cell. You attach the deliverable or asset directly to its milestone’s row in your source table.
Drop the file on the row, and UpSheet stores it in a dedicated Google Drive folder for that sheet and marks the cell with a 📎 paperclip. Each milestone now carries its own deliverable, one click away.
In TABLE mode, each file stays tied to its milestone even as dates shift and rows reorder, so the timeline and the work stay linked. Drag, Drop, Done.
Frequently asked questions
Does Google Sheets have a timeline feature?
Yes. Google Sheets has a built-in Timeline view. Select a table that includes date columns, go to Insert → Timeline, and it creates an interactive timeline you can color and group by category or owner.
How do I make a project timeline in Google Sheets?
The fastest way is the built-in Timeline view (Insert → Timeline) using a table with start and end dates. For a custom, presentation-ready look, build a stacked bar chart with days-from-start and duration helper columns instead.
What’s the difference between Timeline view and a Gantt chart in Google Sheets?
Timeline view is a built-in, interactive way to see tasks over time with minimal setup. A Gantt chart, built from a stacked bar chart, gives more visual control and is better suited to detailed scheduling and presentations.
Can I attach deliverables to milestones in Google Sheets?
Yes, with UpSheet. Drag the deliverable onto its milestone’s row, and it saves to the sheet’s Drive folder with a paperclip marker, so the file behind each milestone stays attached as dates change.
Organize Your Work, Simplify Your Life
A timeline shows when your milestones land. UpSheet keeps the what, every deliverable and asset, attached to the milestones they belong to.
Start your 14-day free trial. It works inside the Google Sheet you already use, so there’s nothing new to learn. Pro is $9.99/month (or $79.99/year) when you’re ready.